Marine heatwaves are lasting longer around Australia. New research maps the hotspots
Marine heatwaves are periods when ocean surface temperatures remain unusually warm for that place and time of year for at least five days.
Published in Progress in Oceanography, a new Australian study has mapped changes in their frequency, duration and intensity across 60 coastal marine bioregions. The researchers analysed daily sea surface temperatures from 1982 to 2024 against a fixed 1982–2011 historical baseline.
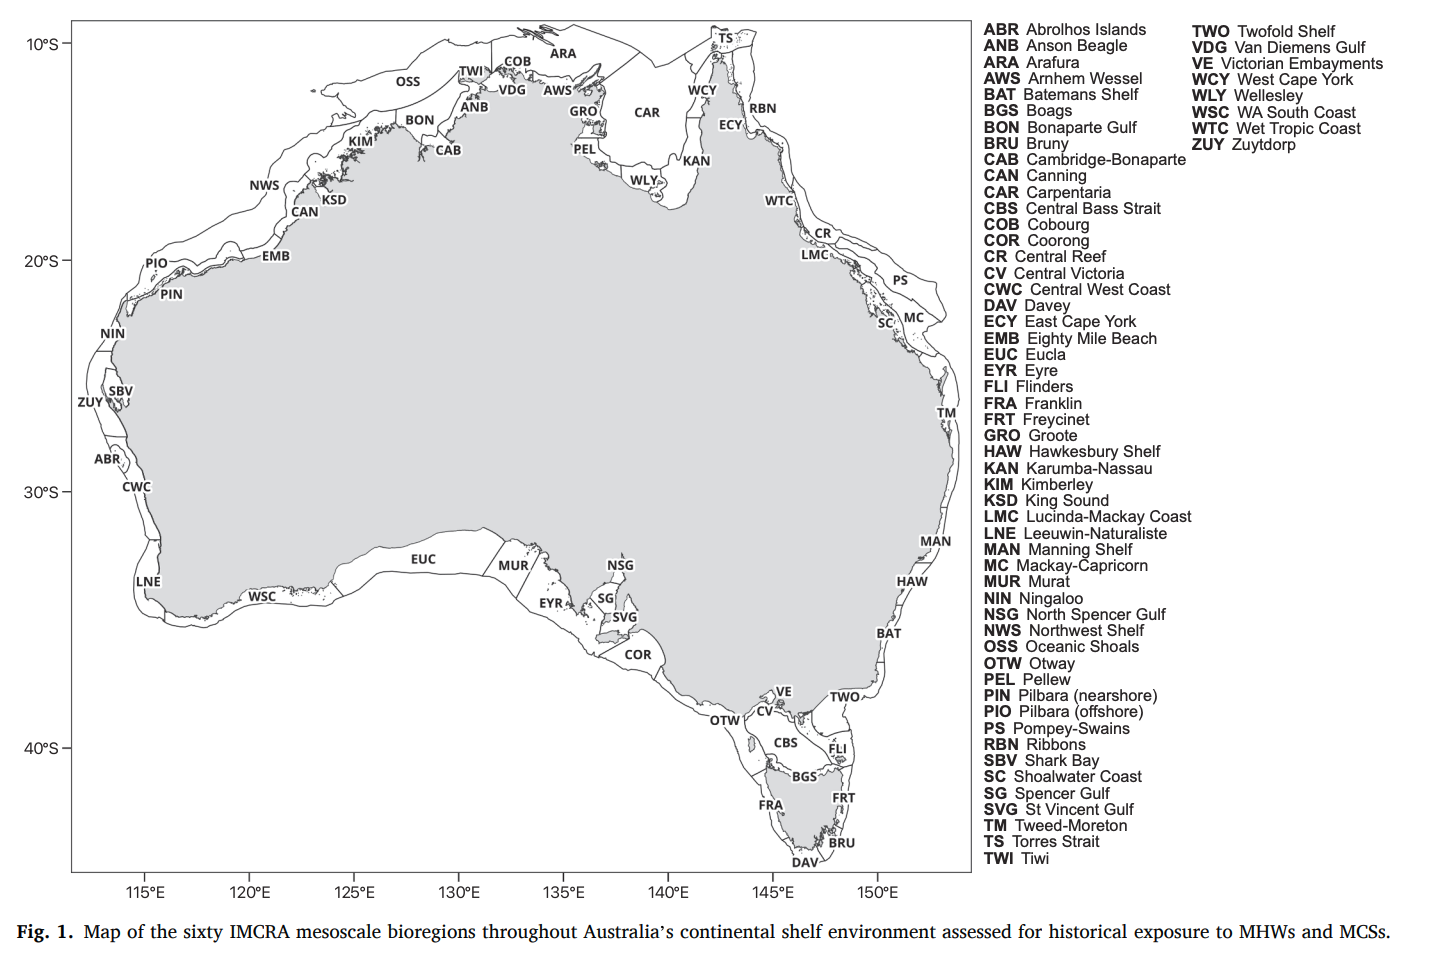
The study used high-resolution data covering grid cells of approximately 22 to 31 square kilometres, restricted to Australia’s continental shelf.
Researchers assessed six measures: event frequency, marine heatwave days, event duration, mean intensity, maximum intensity and cumulative intensity. They also adapted an exposure index combining event intensity, duration and severity to compare historical exposure among bioregions.
Marine heatwave days have increased sharply
When averaged across all 60 bioregions, each of the six marine heatwave measures increased significantly. The average number of marine heatwave days per grid cell rose from 12.5 in 1982 to 96 in 2024. Average event duration increased from 9 days to 26.9 days, while cumulative intensity increased about ninefold.
More than 95 per cent of the bioregions experienced longer marine heatwaves. Fifty-three of the 60 recorded significant increases across at least four of the six measures.
The study’s findings are particularly timely. A Bureau outlook issued on 1 September indicates marine heatwave conditions in parts of Great Southern Reef waters from September to December, although the broad-scale forecast may not reflect fine-scale nearshore conditions.
HOW TEMPERATURE EXTREMES DIFFER AROUND AUSTRALIA
-
![]()
MARINE HEATWAVE EXPOSURE
Across the full study period (1982 - 2024), several bioregions in western, northern and south-eastern Australia ranked among those most exposed to marine heatwaves.
-
![]()
WARM-SEASON HOTSPOTS
During the warmest months (January to March), high exposure was concentrated along Western Australia and around Bruny and Davey in Tasmania.
-
![]()
MARINE COLD-SPELL EXPOSURE
Across the full study period (1982 - 2024), the strongest marine cold-spell exposure occurred mainly across northern and western Australia. Batemans Shelf was one of the few east-coast regions with elevated exposure.
-
![]()
COLD-SEASON EXTREMES
Marine cold spells in cooler months (July to September) showed a different geographic pattern. Batemans Shelf ranked highly for exposure to both marine heatwaves and cold spells.
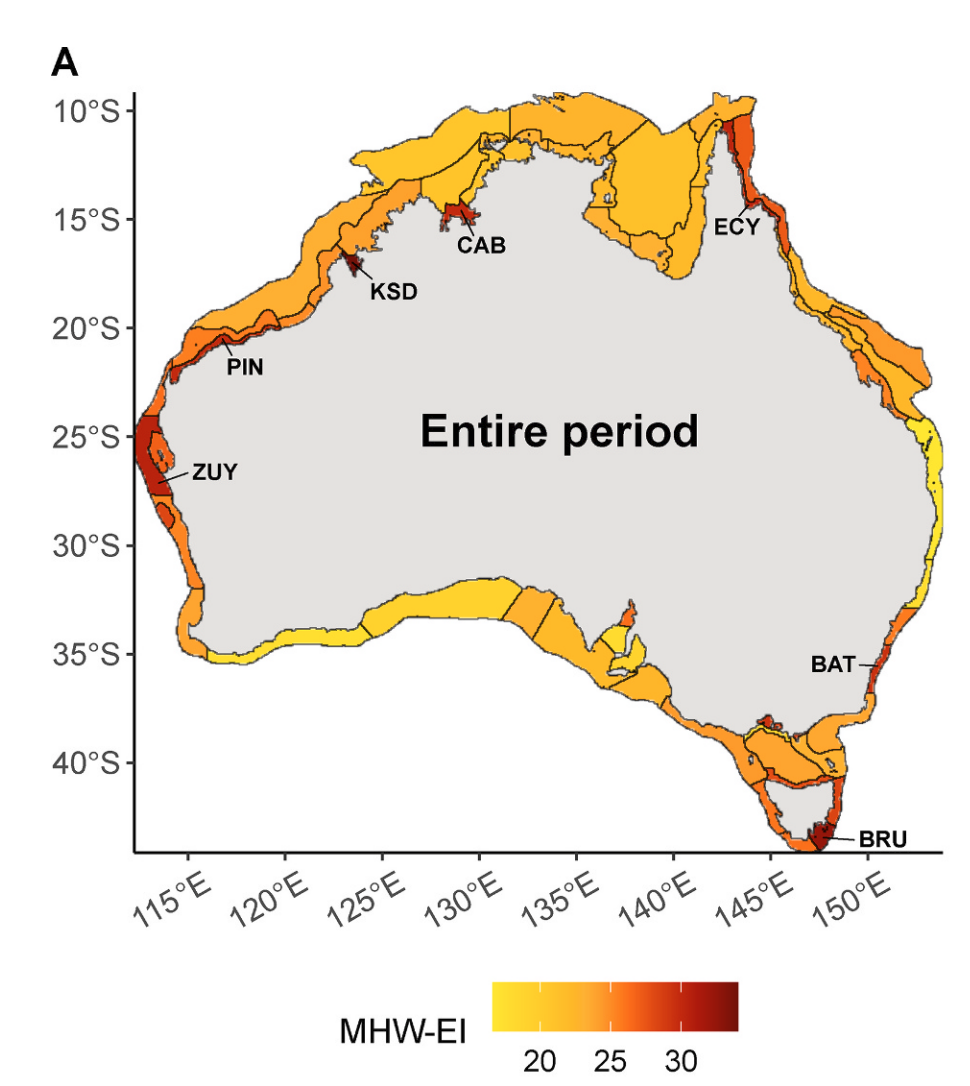
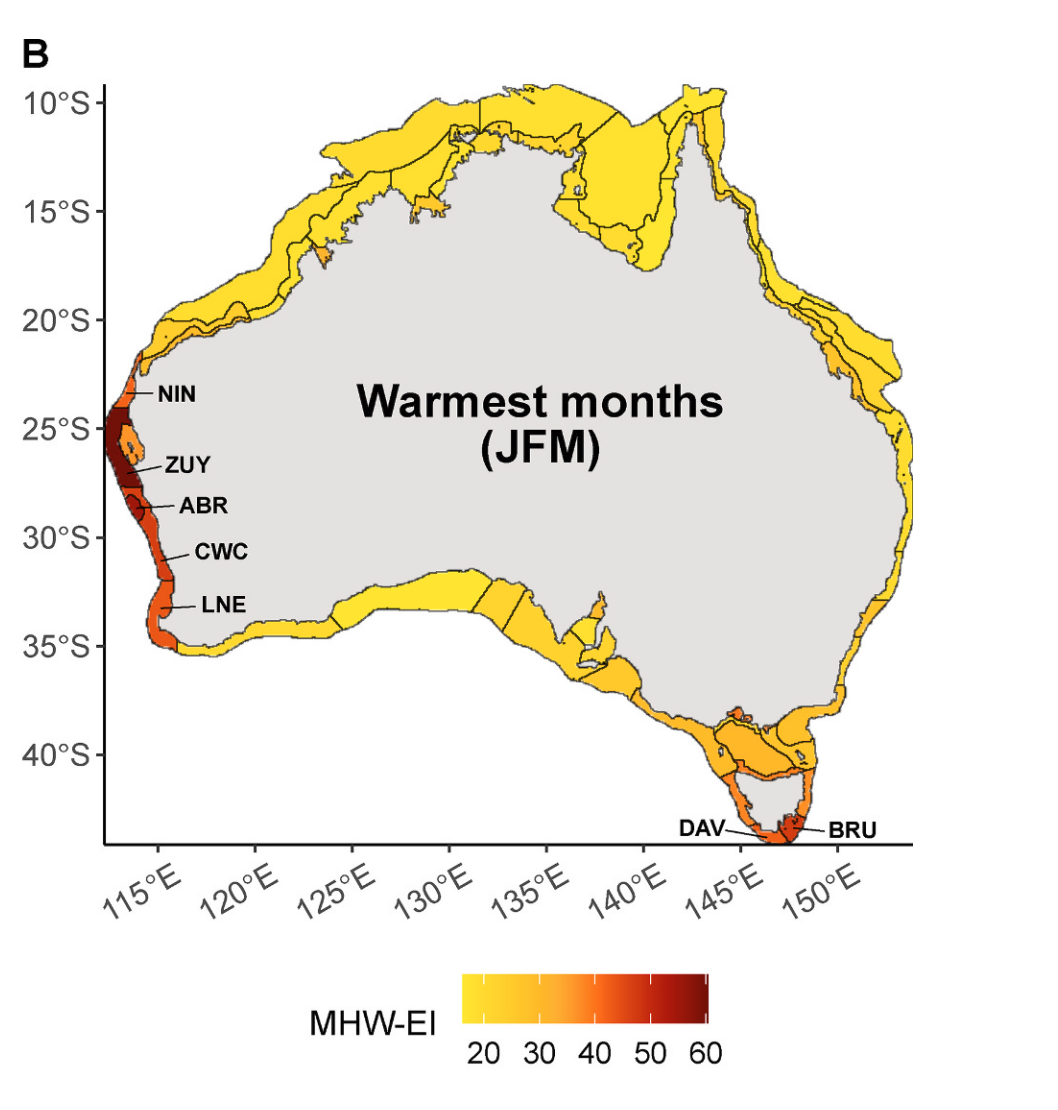
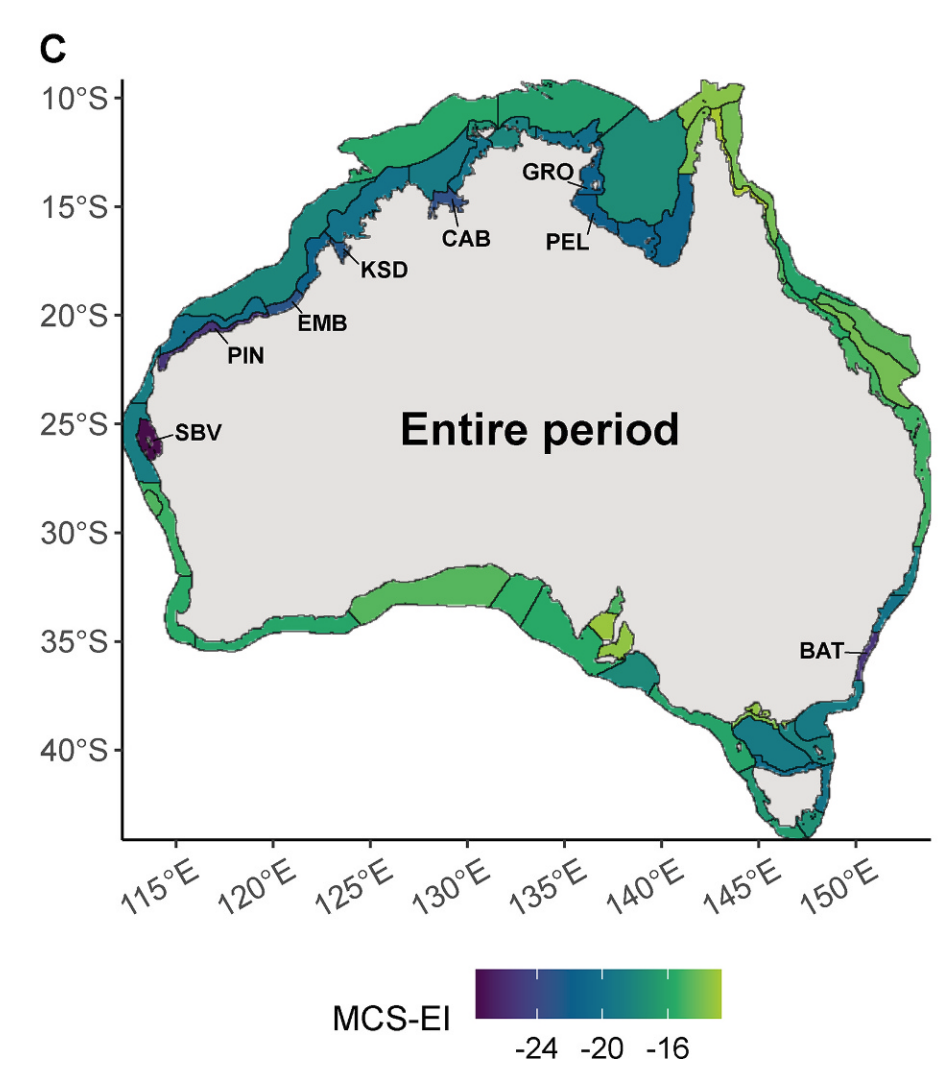
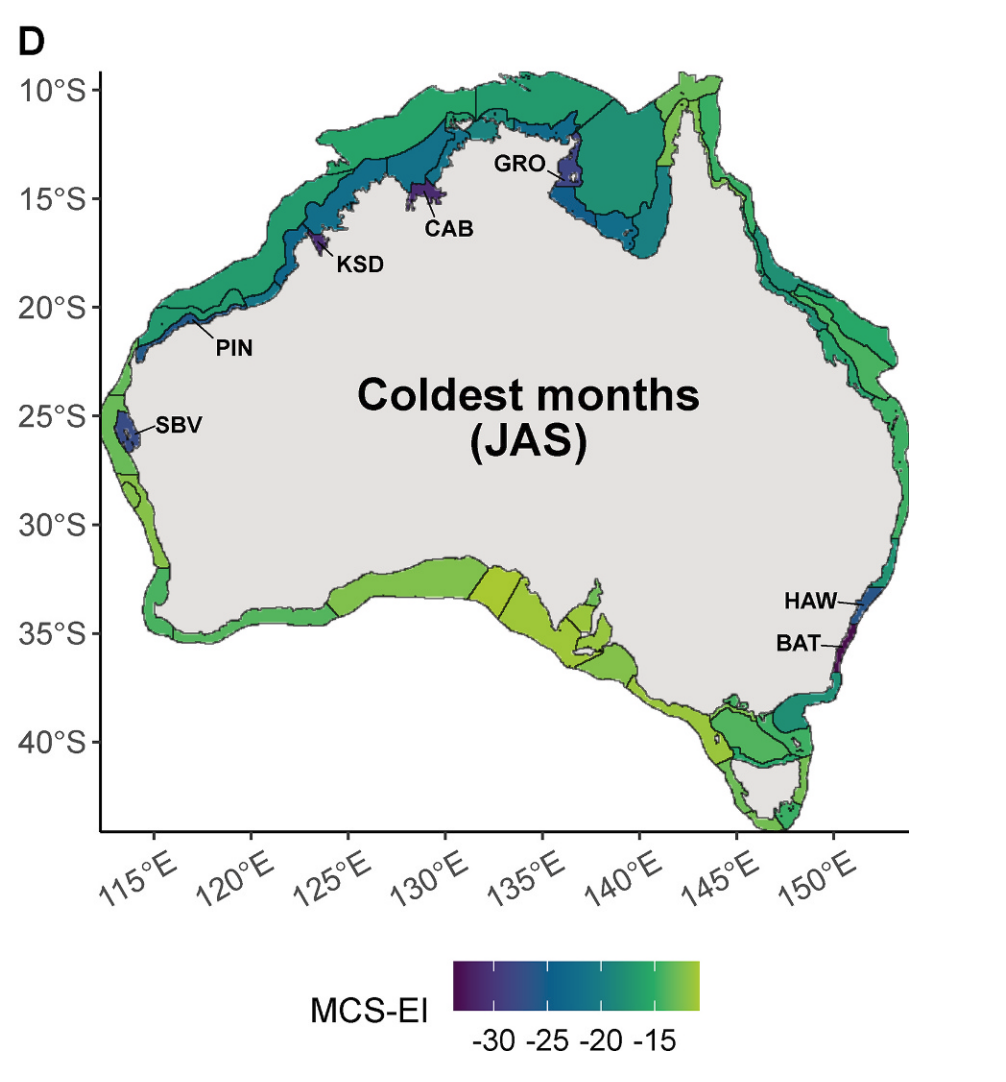
The Great Southern Reef spans thousands of kilometres, but its bioregions have not experienced the same pattern of extreme heat.
Several regions within the reef, or near its northern boundary in Western Australia, ranked among Australia’s most exposed. These included Zuytdorp, the Abrolhos Islands, Central West Coast and Leeuwin-Naturaliste in Western Australia, Batemans Shelf in New South Wales, and Bruny and Davey in Tasmania.
The authors interpret these patterns in the context of major marine heatwave events and regional ocean processes.
Different heat histories along one reef


A clear signal from North Spencer Gulf
South Australia’s North Spencer Gulf was not among the 12 bioregions identified as potential hotspots by either the full-year or January–March marine heatwave exposure index. However, it recorded the fastest increases in mean and maximum marine heatwave intensity across all 60 bioregions.
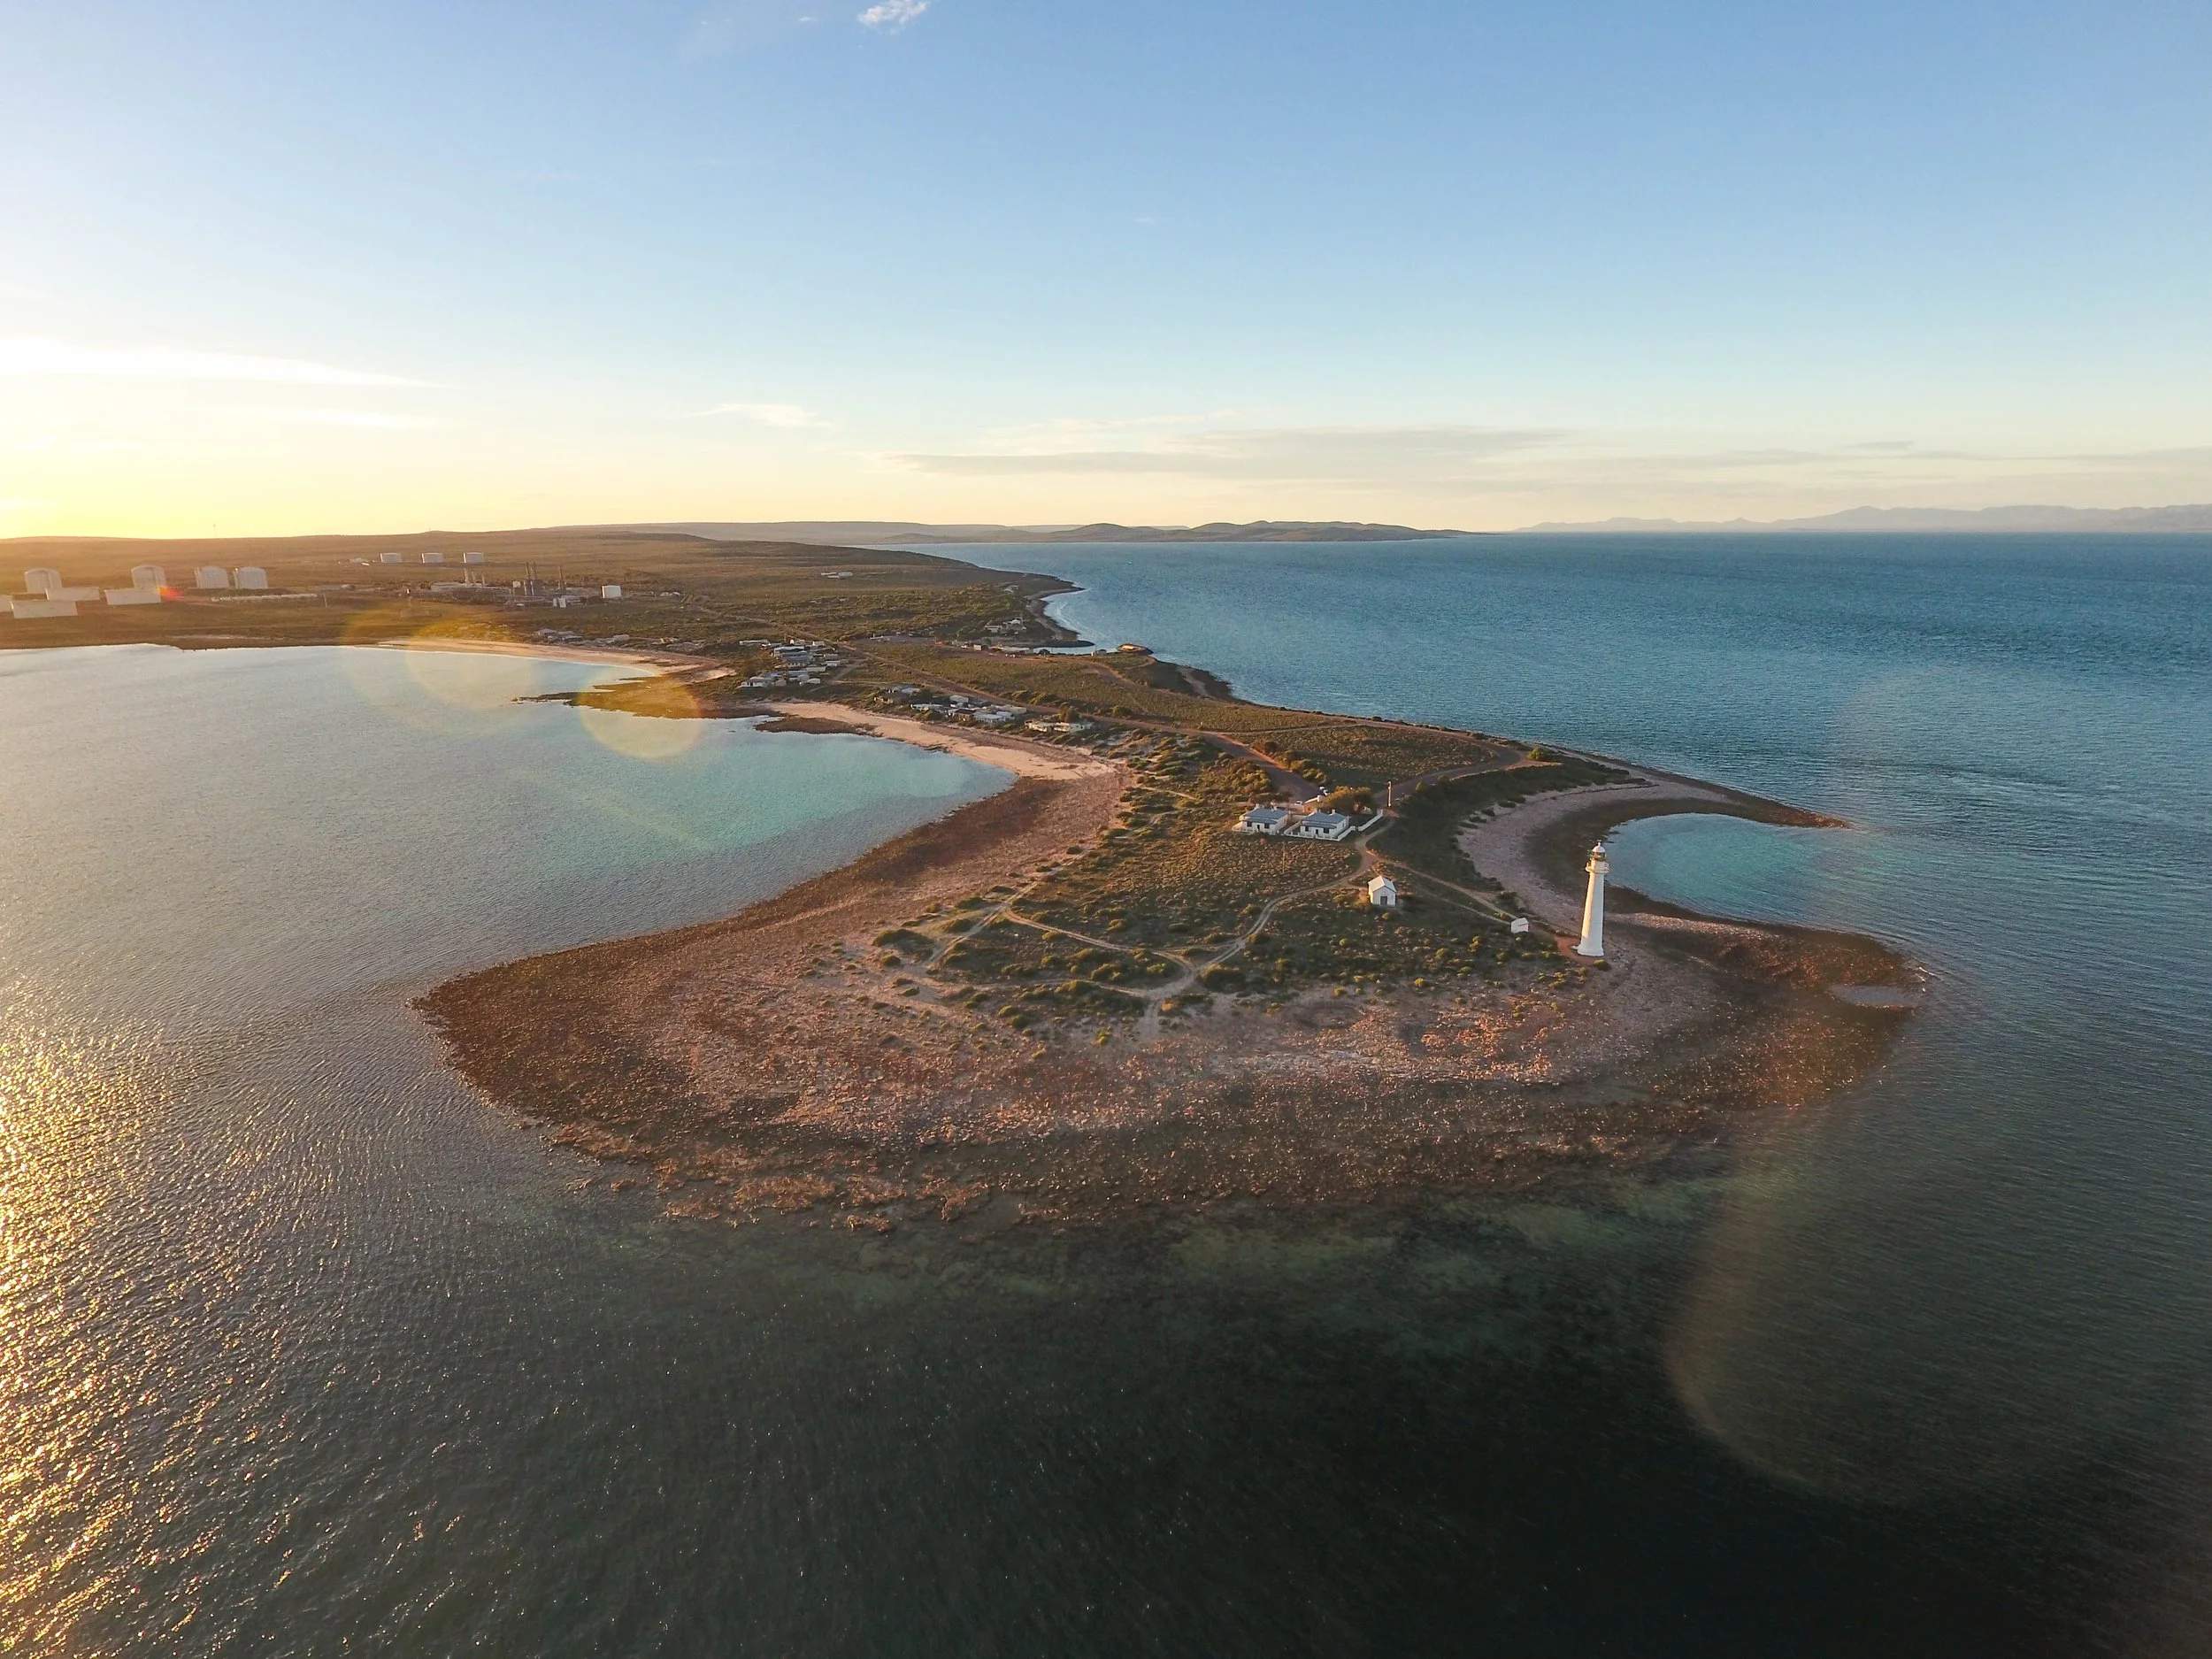
Across the 43-year study, the fitted trends correspond to an increase of about 0.6°C in mean heatwave intensity and 1.1°C in maximum intensity between 1982 and 2024. These figures describe long-term trends rather than direct comparisons between measurements taken in 1982 and 2024.
Using history to prepare for future events
The authors propose using historical heat exposure to guide ecological monitoring, marine planning and regional response plans.
“The conditions we see in our oceans today are only a snapshot of what marine ecosystems have experienced over decades. Looking back allows us to understand that environmental history and gives us a better foundation for thinking about how ecosystems may respond and how we can prepare for what comes next.”
Lead author Sheena Chung, Southern Cross University

Areas with high or rapidly increasing exposure are strong candidates for sustained monitoring. Surveys conducted before, during and after an event can show how kelp forests, seagrass, fishes, invertebrates and threatened species respond.

The same information could support marine protected area planning, aquaculture risk assessments and ecosystem reporting. However, the exposure index is not a complete measure of vulnerability. Species sensitivity, adaptive capacity, habitat condition and other local pressures must also be considered.
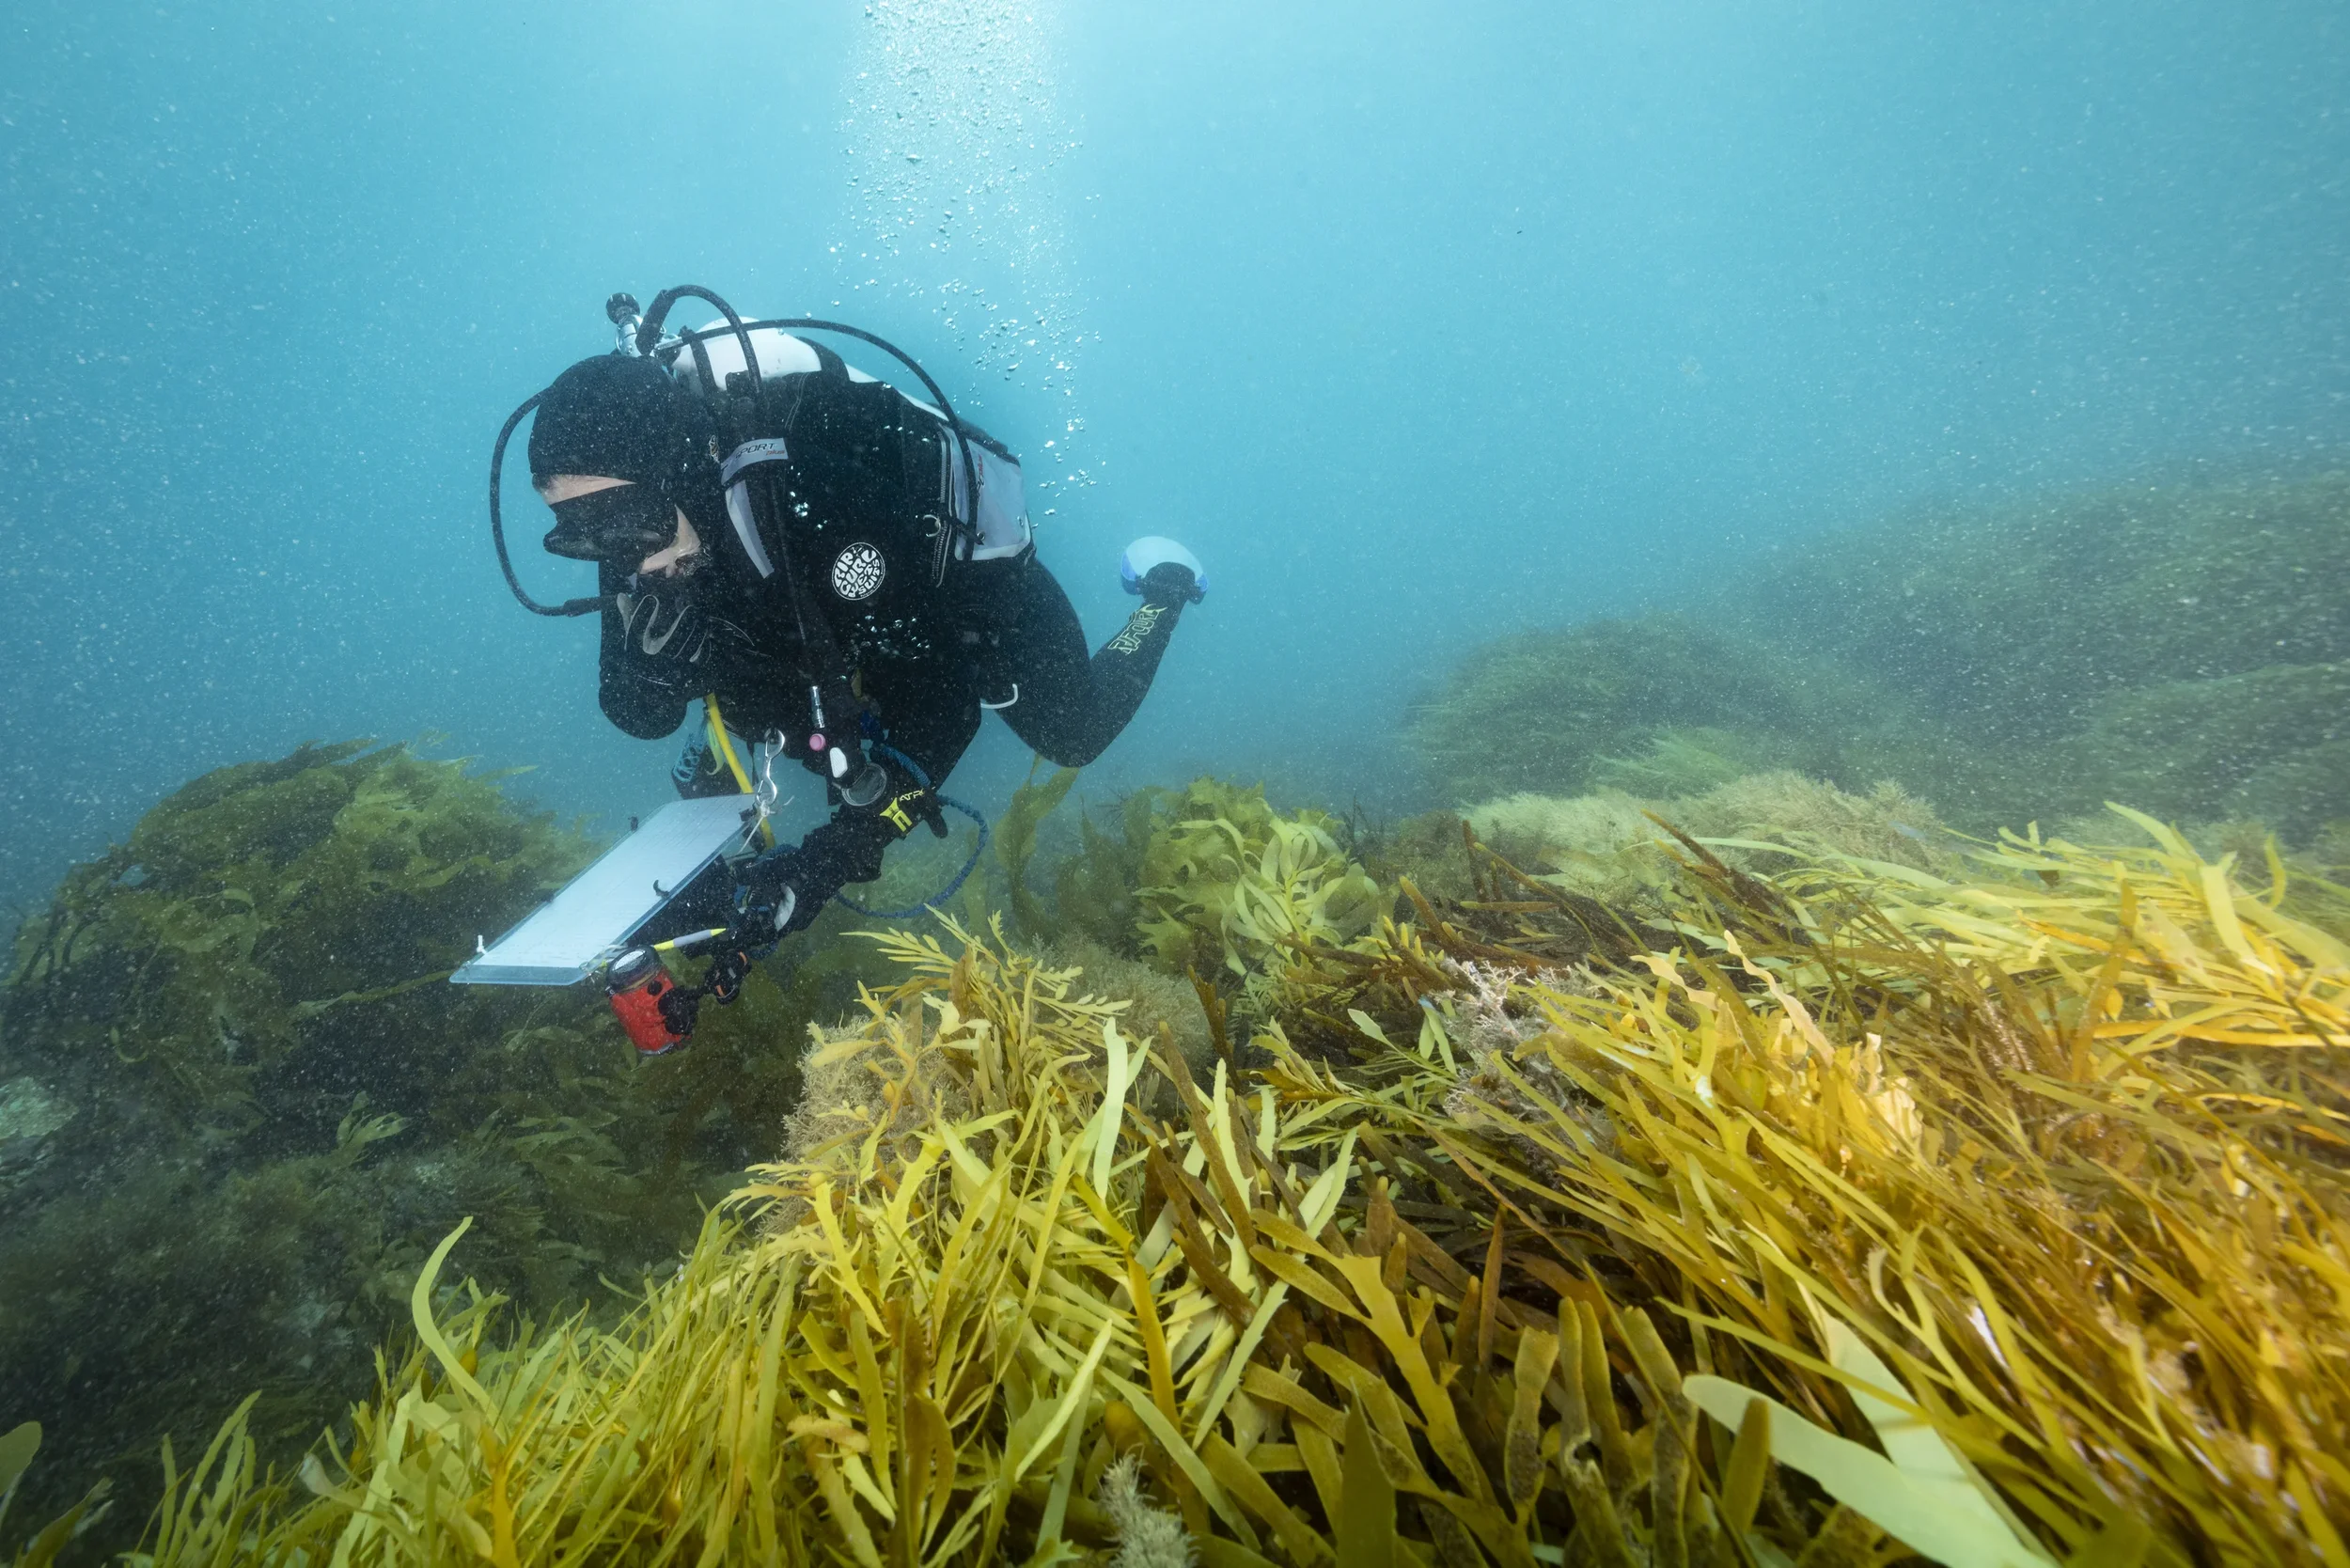
The study only assessed surface temperatures. The authors identify subsurface observations as an important next step because heatwaves below the surface can differ from those observed at the surface.
Different heat histories call for different responses
Over the past four decades, marine heatwave exposure has increased across most Australian coastal bioregions, but not in the same way everywhere.
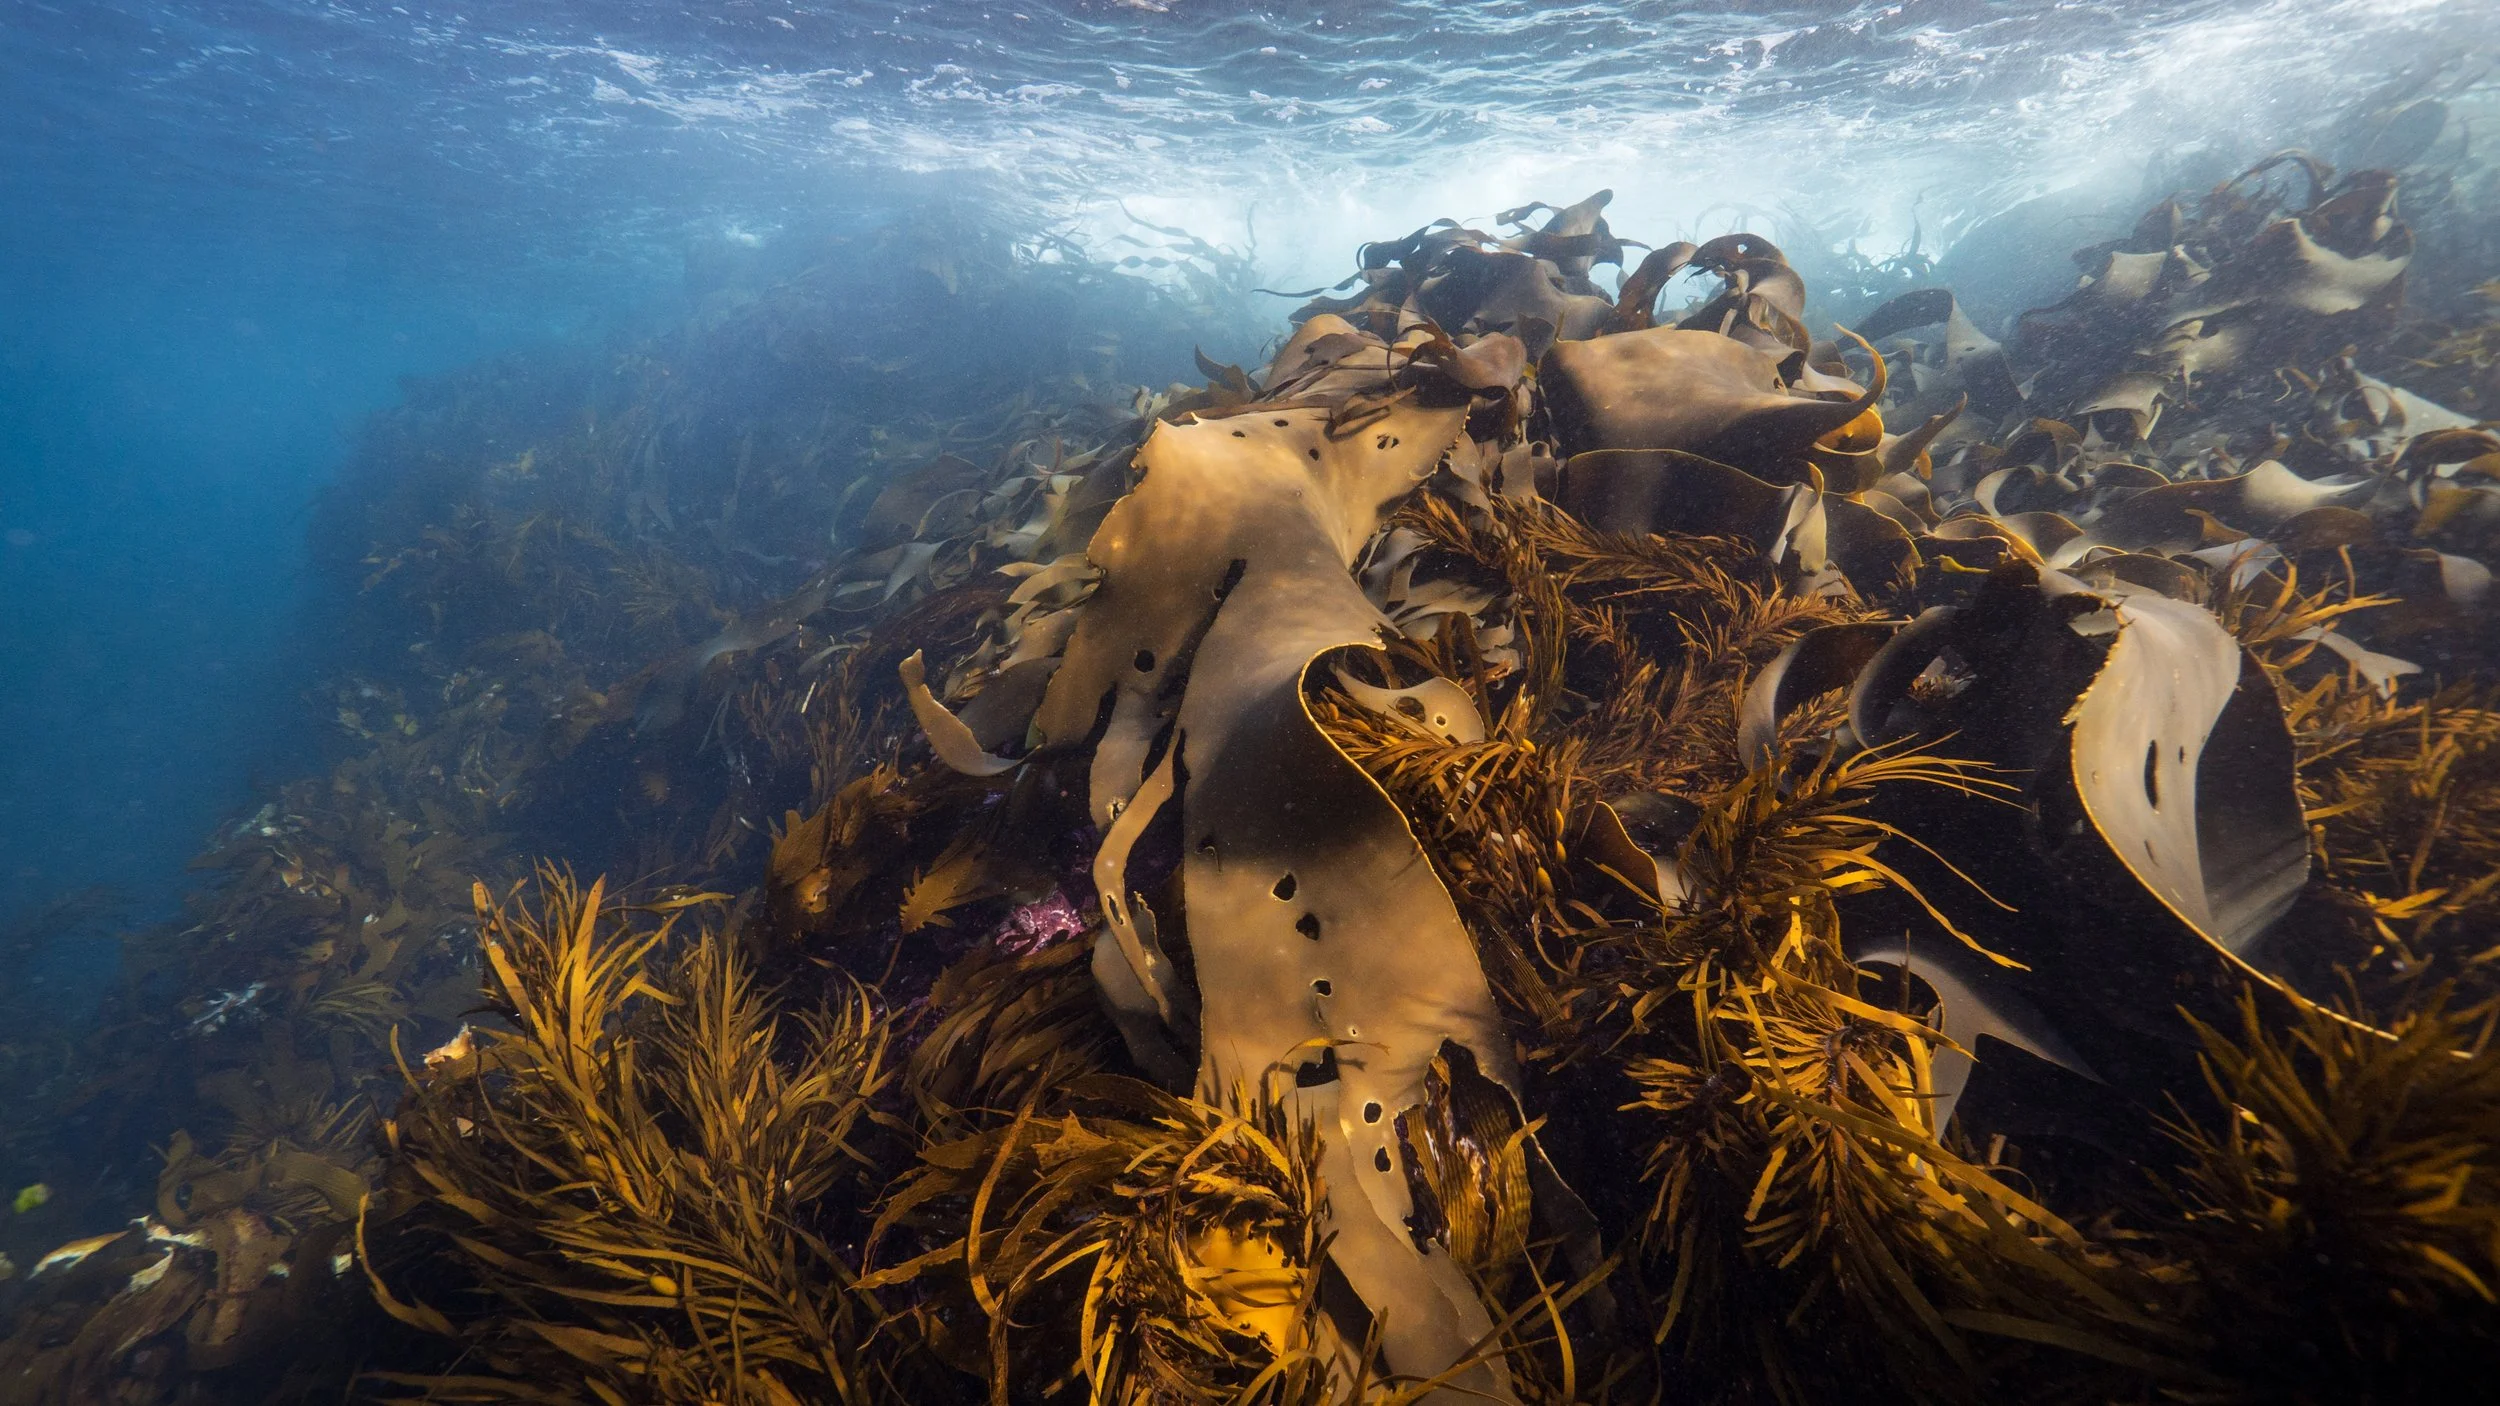
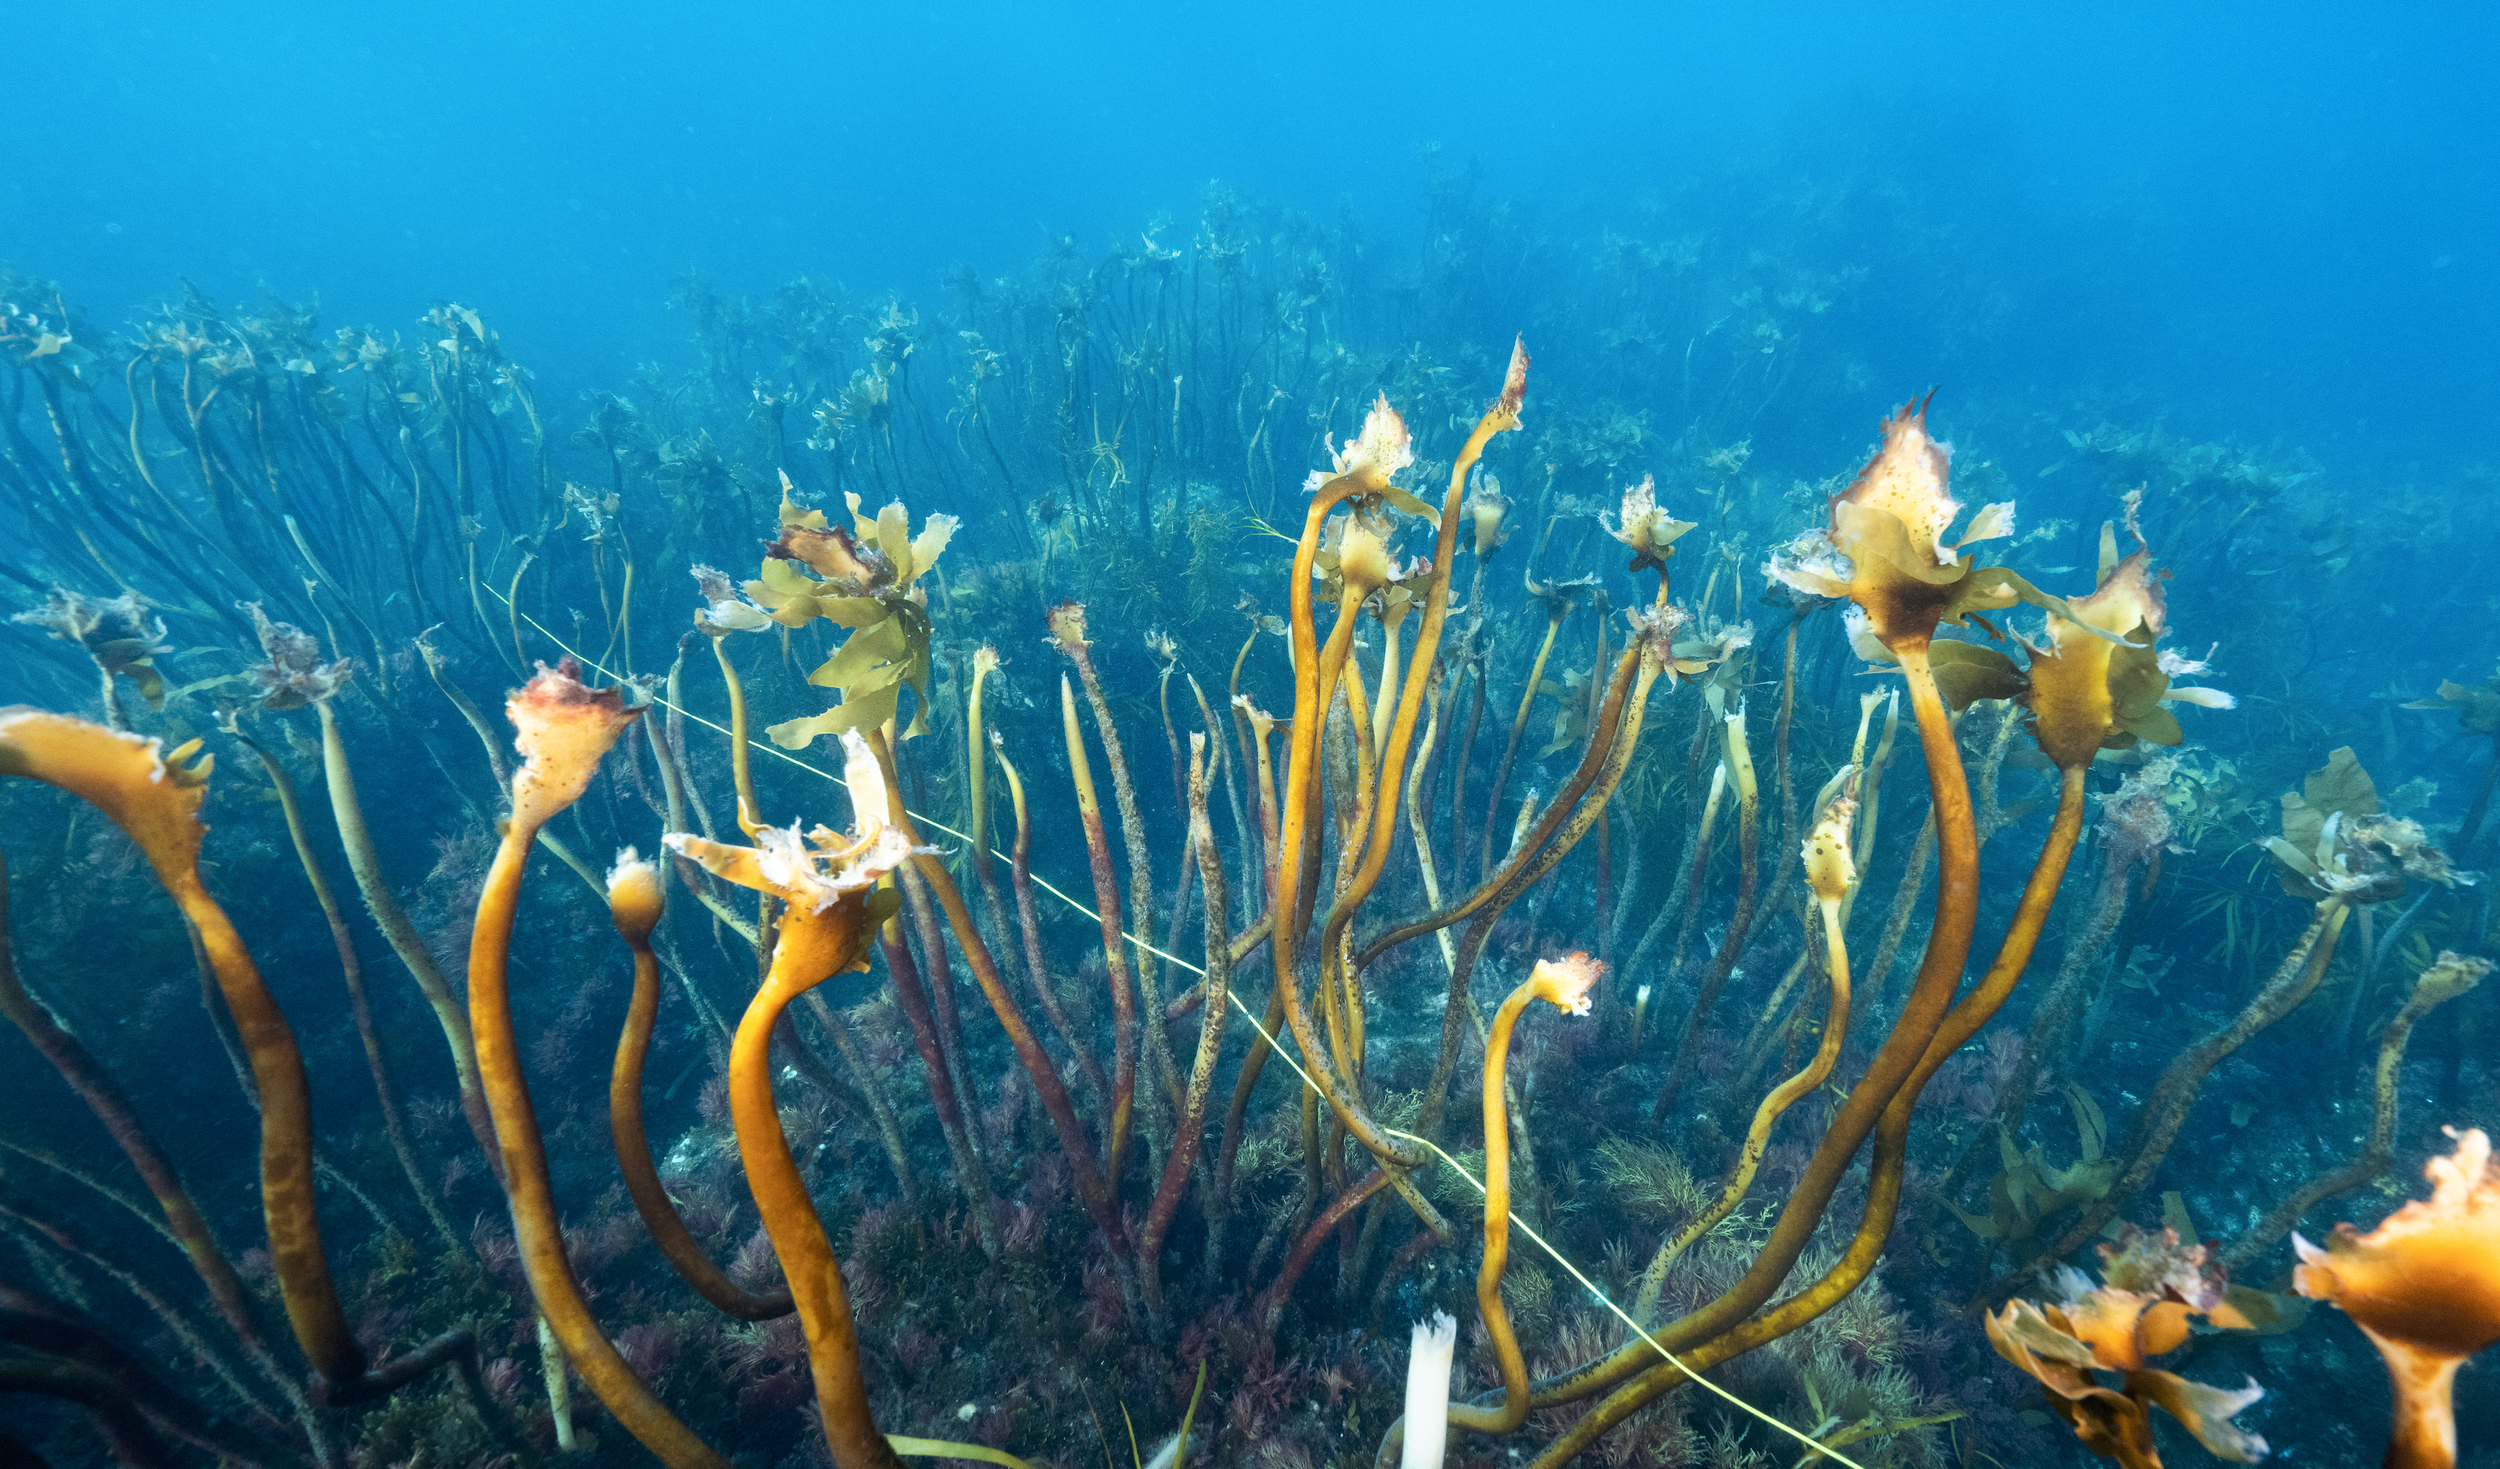
Along the Great Southern Reef, some regions have been shaped by exceptional events, others by persistent lower-intensity heat, while some places are experiencing especially rapid increases in intensity. Recognising these distinct heat histories can help researchers and managers interpret ecological change, target long-term monitoring and prepare regional responses for future events.
Join Our Community
Sign up to our monthly newsletter to receive the latest updates from around the GSR.
you may also like
-
![]()
Squidle+, AI and Reef Monitoring
Squidle+ acts as shared infrastructure for marine science. It supports collaborative annotation, quality control between people and algorithms, map-based data exploration, integration with other portals, and the export of training data for machine learning.
-
![]()
Southeast Marine Park Network
When the South-east Marine Parks were first established, little was known about what lay beneath these remote waters. Two decades of research, supported by Parks Australia and the Marine Biodiversity Hubs, has built a much clearer picture of these ecosystems.
-
![]()
more ARTICLES
A deeper look at timely reef topics, stories and insights from science, community voices and coastal experiences.
-
![]()
VIDEOS
Check out our short films and clips about temperate reef life, research in action, community work and reef encounters across southern Australia.
-
![]()
FEATURE CREATORS
Each month we feature a creator from across the Great Southern Reef sharing their connection to the coast through photography, art and storytelling.