HEALING SEA COUNTRY
-
o Understand what sustainable seafood means and why it matters.
o Predict how seafood products might differ by source, harvest method, price, and sustainability.
o Investigate real seafood products and record accurate information from labels and packaging.
o Use evidence to compare products and judge sustainability claims.
o Communicate findings clearly to the public using an infographic with data.
-
o I can explain what sustainable seafood is and why consumer choices matter.
o I can accurately record and compare seafood product information using evidence from packaging and labels.
o I can use sustainability evidence to rank seafood products and justify my decisions.
o I can clearly communicate findings and recommendations using a simple infographic and data display.
Seafood choices and sustainability
Every time you buy seafood, you influence what happens in the ocean. Some seafood comes from well-managed fisheries that protect marine ecosystems. Other products come from overfished stocks or practices that damage habitats. The challenge is knowing the difference.
In this activity, you will step into the role of a seafood detective. You’ll investigate seafood products available in your local supermarket and examine where they come from, how they’re harvested, and how sustainable they are. By the end, you’ll see how everyday consumer choices can shape the future of marine life.

Before you investigate, take a moment to think about the questions below before heading to the supermarket.
27. What does sustainable seafood mean to you?
28. How can consumer choices encourage more sustainable seafood practices?
Before your investigation begins, use what you already know to make predictions about common seafood species such as tuna, salmon, sardines, or others you expect to see.
29. Use the table below and your workbook to record your predictions before moving on.
Make your predictions
Before visiting the supermarket, use the dropdown menus to record your predictions for each seafood species.
| Species | Wild-caught or farmed | Harvest method | Expected price | Sustainability |
|---|---|---|---|---|
| Tuna | ||||
| Salmon | ||||
| Sardines |
These are predictions only. You will compare them with real products during your supermarket investigation.
supermarket INVESTIGATION
Now, head to your local supermarket.
Choose 3 to 5 different seafood products. These may come from:
The fresh seafood section
Canned seafood
Packaged seafood
While you’re there, take notes or photos (if permitted) and collect the following information for each product.
Information to record
A) Species
What species is it?
Common names are the everyday names we use for animals, but they can vary between regions. For example, Centrostephanus rodgersii is known as the longspined sea urchin in New South Wales and Tasmania, but is often called the black sea urchin in Victoria. To avoid confusion, scientists use scientific names, a system called binomial nomenclature. Each species has a two-part name:
Genus – the broader group
Species – the specific organism
Scientific names are used worldwide and clearly identify the organism being described.
B) Harvest method
Is the seafood labelled as:
Wild-caught
Farmed (aquaculture)
C) Source
Where was the seafood sourced from?
This may include a country, region, or specific fishery.
D) Sustainability certification
Does the product display any sustainability labels, such as:
Marine Stewardship Council (MSC) for wild-caught seafood
Aquaculture Stewardship Council (ASC) for responsibly farmed seafood
Any other recognised sustainability certification
E) Quantity and price
Record:
The quantity of seafood in the product
The price
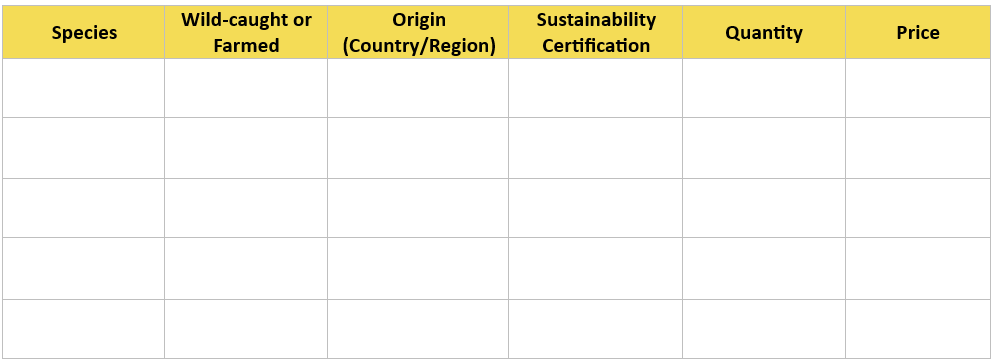
30. Draw up a table like this to record your findings:
compare your findings
Use the questions below to guide your discussion.
a) Was it easy or difficult to find seafood with sustainability certification?
b) Did the packaging provide enough information to help you make an informed choice?
c) Were there more wild-caught or farmed options available?
d) Did anything surprise you about what you found?
e) Was sustainably certified seafood more expensive than non-certified seafood?
Be prepared to share one key insight from your group with the class.
Extension Activity
Now it’s time to share what you found.
Create an infographic that clearly communicates your results in a way the public could understand. You can use Canva, PowerPoint, or create it by hand. Focus on clarity, accuracy, and visual impact.
Your infographic should include:
1. Seafood ranking
Create a simple ranking system that labels seafood products from:
Best Choice
Good Alternative
Avoid
Base your rankings on sustainability information you collected.
2. Data visualisation
Include at least one graph that shows:
The percentage of certified vs. uncertified seafood products you found
Choose a graph type that makes the comparison easy to understand.
3. Consumer recommendations
Explain practical actions consumers can take to support more sustainable seafood, such as:
What labels to look for
Which products to choose more often
How buying habits can influence fishing practices
Presentation tip: Your infographic should be clear enough that someone who did not complete this activity could still understand your message.
Self Reflection: How am I going?
Think about today’s learning on seafood choices and sustainability.
For each success criteria, choose a traffic light.
🟢 Confident · 🟡 Getting there · 🔴 Still working on it