ECOSYSTEM (IM)BALANCE

-
o Understand what an urchin barren is and how unchecked sea urchin populations affect kelp forest ecosystems.
o Compare species outbreaks across ecosystems by investigating similarities and differences between longspined sea urchin and Crown-of-Thorns starfish outbreaks.
o Analyse ecological, economic, and management aspects of species outbreaks to understand their broader impacts.
o Develop skills in selecting appropriate graph types to represent ecological data
accurately.
o Link species abundance to ecosystem impacts, considering long-term drivers such as climate change.
o Develop critical thinking and problem-solving skills by proposing explanations for observed patterns and impacts.
-
o Complete a comparative table for longspined sea urchins and Crown-of-Thorns starfish, accurately placing information about predators, ecosystems, population drivers, and management approaches.
o Create graphs representing sea urchin abundance and percentage of barren cover over time and across depth categories.
o Calculate sea urchin density at different depths and years using provided data.
o Analyse trends and patterns in the data.
o Evaluate potential long-term impacts on ecosystems, including links to climate change.
o Communicate findings clearly using accurate visual representations.
defining an Urchin Barren

7. Drag the three words into the blanks to complete the definition of an urchin barren. Then write the completed sentence in your workbook.
barren
abundant
kelp
decline
An urchin
is an area where sea urchins become
and overgraze
,
leading to a
in biodiversity.
7b. Using the completed sentence, underline the cause and circle the effect in your definition.
Extension. Rewrite the definition of an urchin barren in your own words, without using the words barren, abundant, kelp, or decline.
when grazers reshape reefs
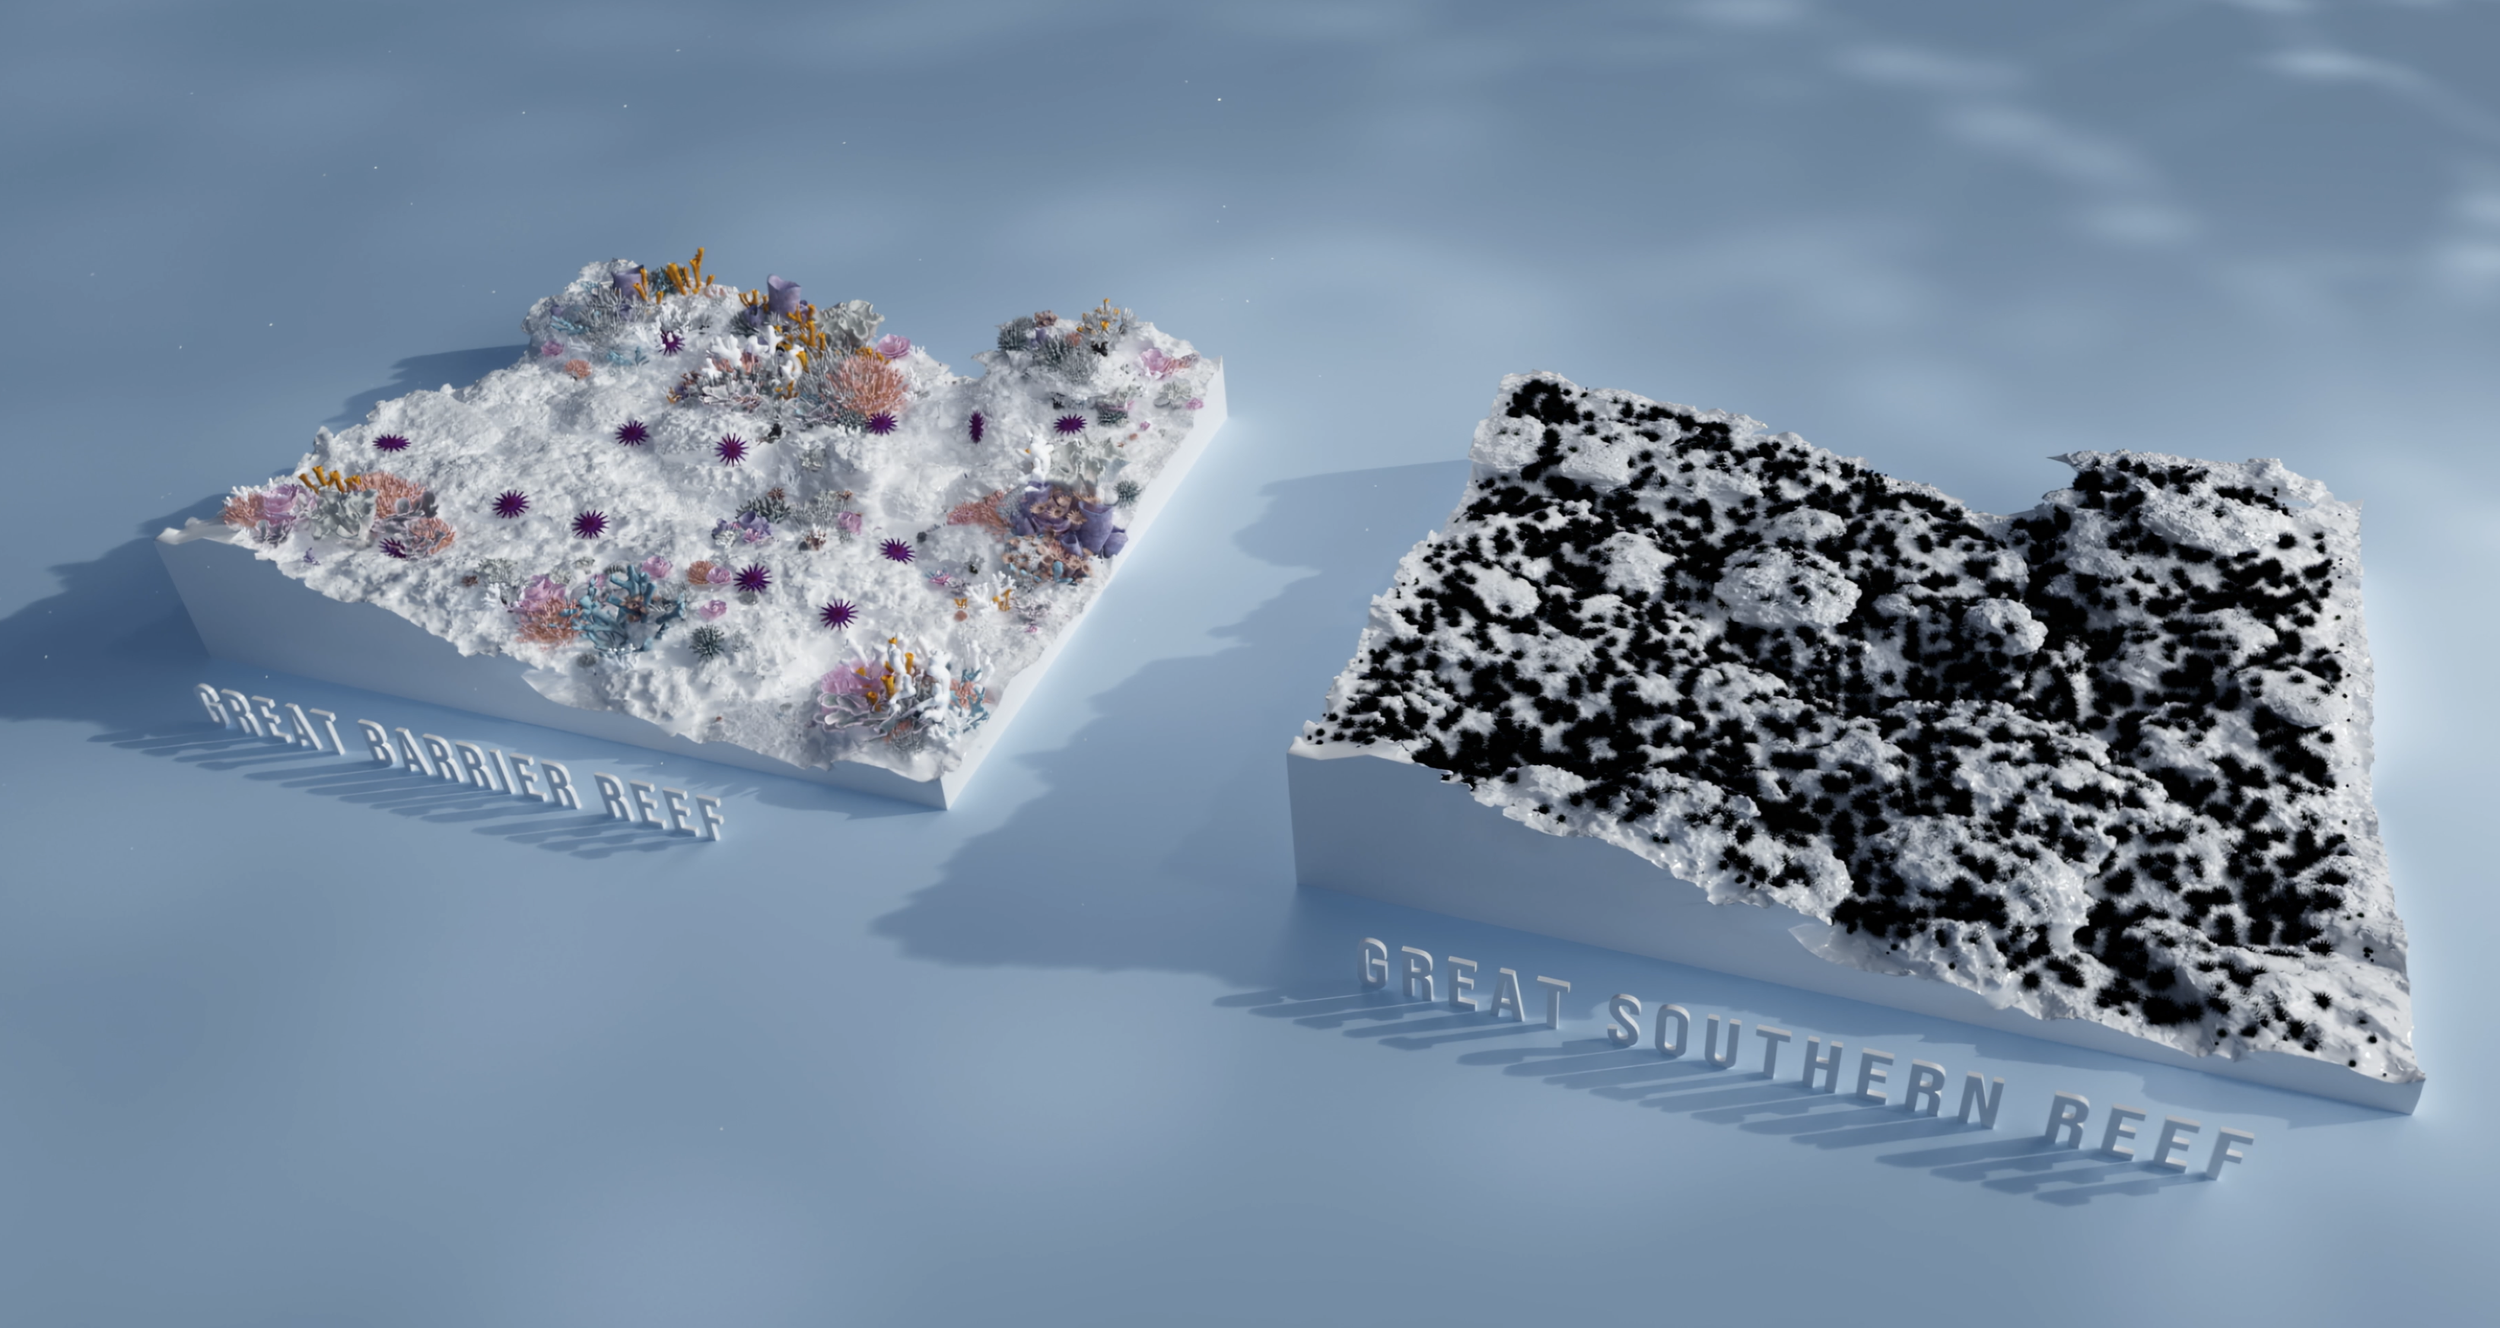
In White rock, Damon compares the outbreak of the Crown-of-Thorns starfish in the GBR with the longspined sea urchin barrens in the GSR
8. Match the text below to the correct spaces in the table (click here for Google Sheet). To help with the Crown-of-Thorns Starfish section, explore the linked webpage for more details.
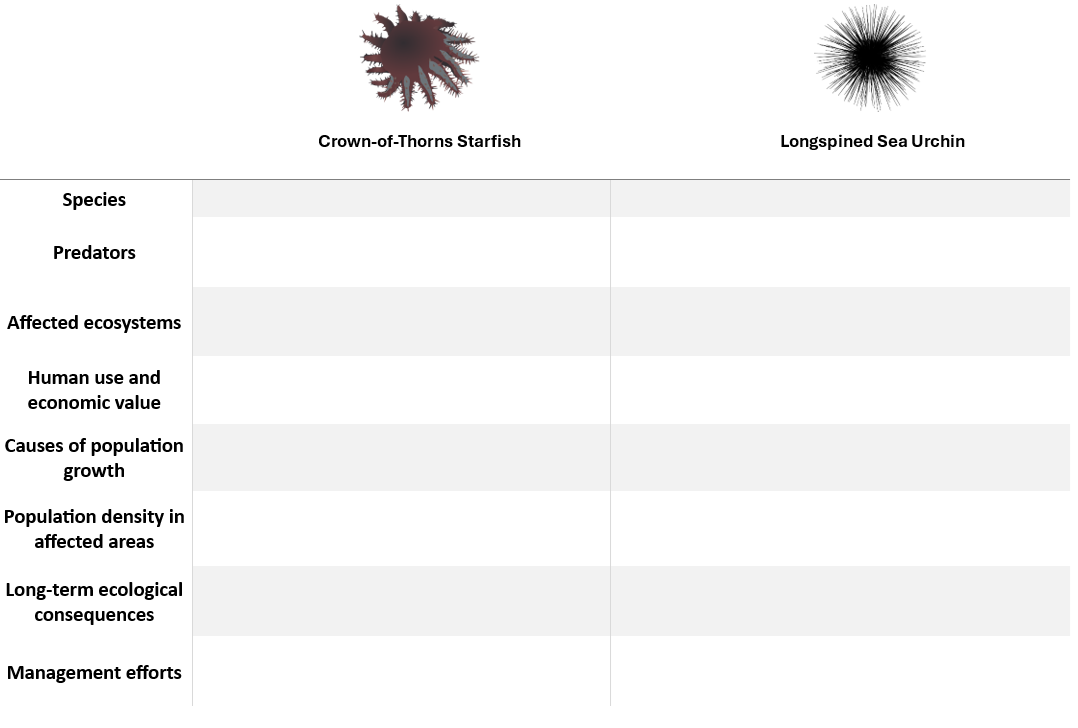
© IAN Symbols: Crown-of-Thorns starfish; Tracey Saxby, Integration and Application Network (ian.umces.edu/media-library), Longspined Urchin, Jane Hawkey, Integration and Application Network (ian.umces.edu/media-library).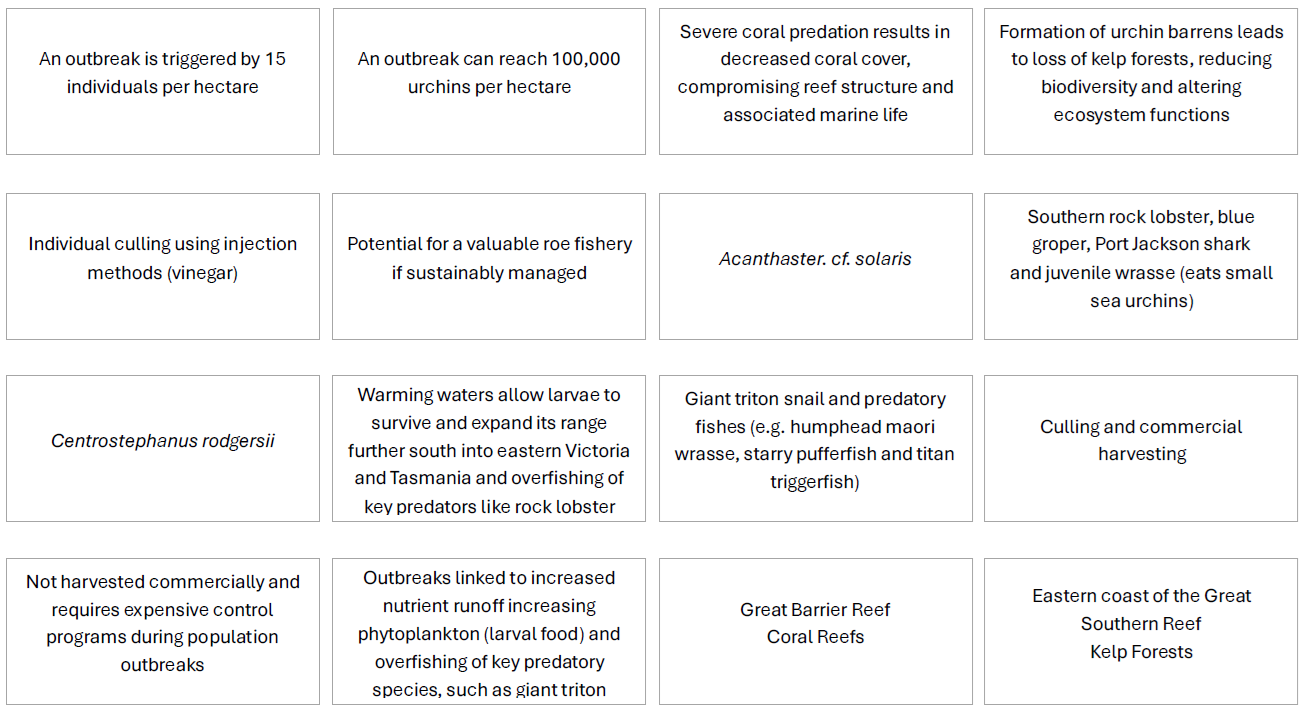
Explosion of Sea Urchins
In the early 2000s, Dr. Scott Ling, at the Institute for Marine and Antarctic Studies (IMAS), University of Tasmania, surveyed the abundance of longspined sea urchins and the extent of barren reef cover along Tasmania's east coast.
In 2016–2017, Dr Ling returned to the same sites to measure how conditions had changed over time. The results showed major shifts in both sea urchin numbers and barren reef cover. Watch the video above to learn more about what was observed.
You are now part of Dr Ling’s research team.
Your task is to analyse the data and present it visually so the team can discuss patterns and changes over time. Using the data provided (click here for the Google Sheet), complete the following tasks.
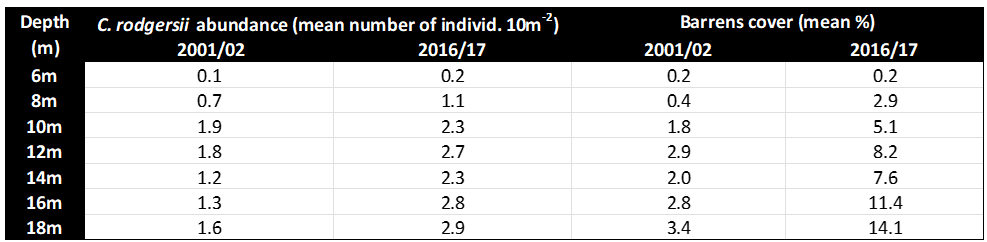

9. Create two separate graphs to show the changes between 2001/2002 and 2016/2017 using the values in the table:
a) Plot the abundance of C. rodgersii over time at different depths.
b) Plot the barrens cover percentage over time at different depths.
You may draw the graphs in your workbook or create them digitally using Excel or Google Sheets.
Use different colours or line styles to clearly distinguish between the two time periods.
Tip: Bar graphs work well for comparing values, but line graphs can also be used to show change over time.
visualising urchin densities
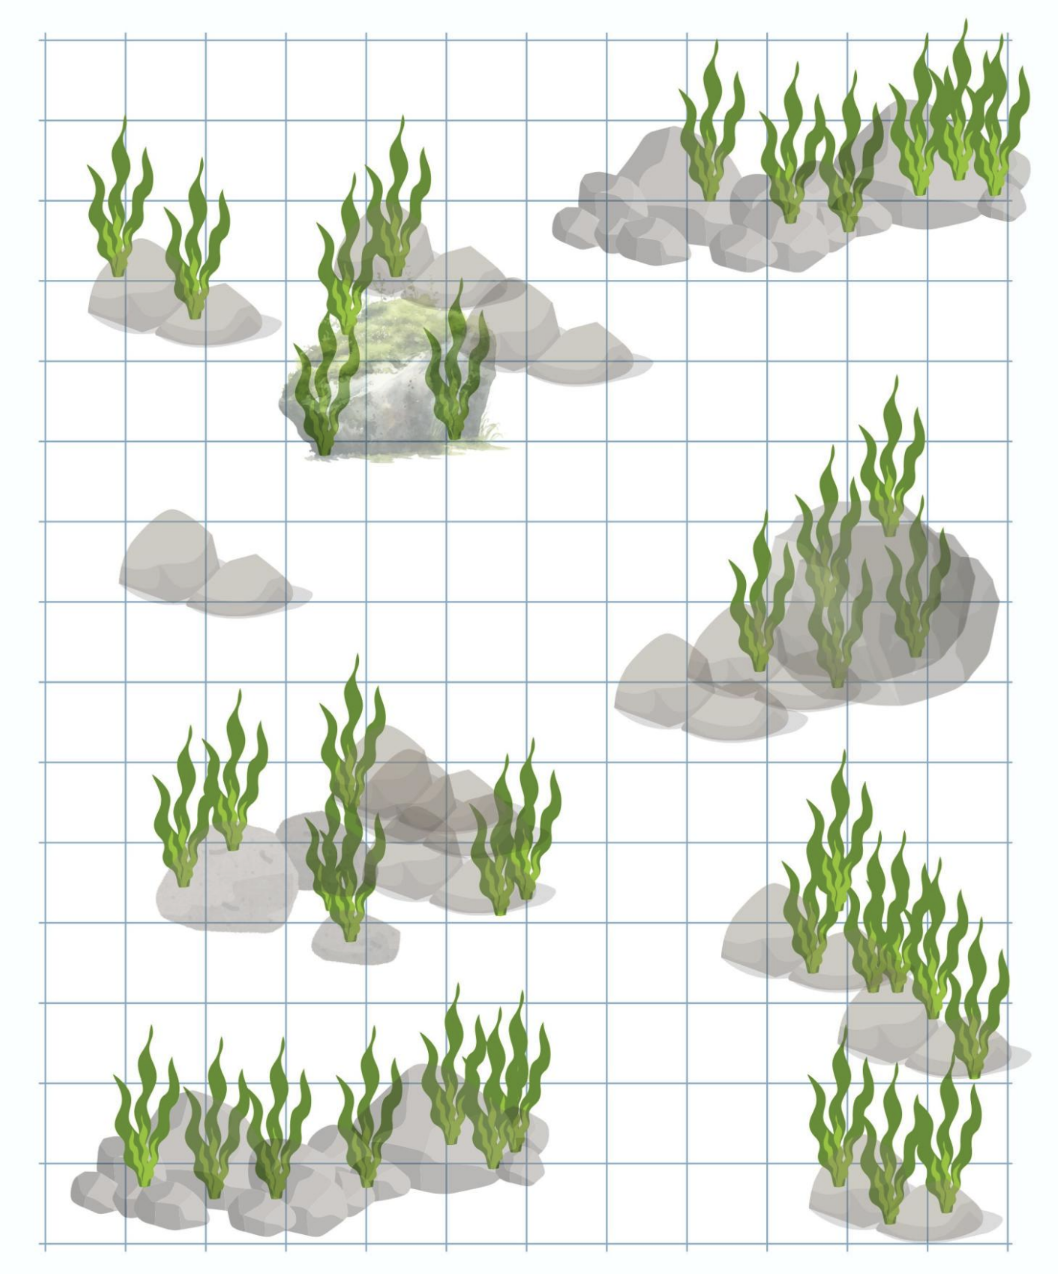
This grid (click here for Google Sheet) represents a section of reef at a specific depth.
Each 3 × 3 block represents 10 m²
The full grid represents 200 m²
10. Using the grid and Ling’s data, draw sea urchins to represent the recorded densities for:
2001/2002
2016/2017
Do this for at least one depth category.
An example is provided below showing how to calculate and draw sea urchin density at 12 m depth in 2016/2017.
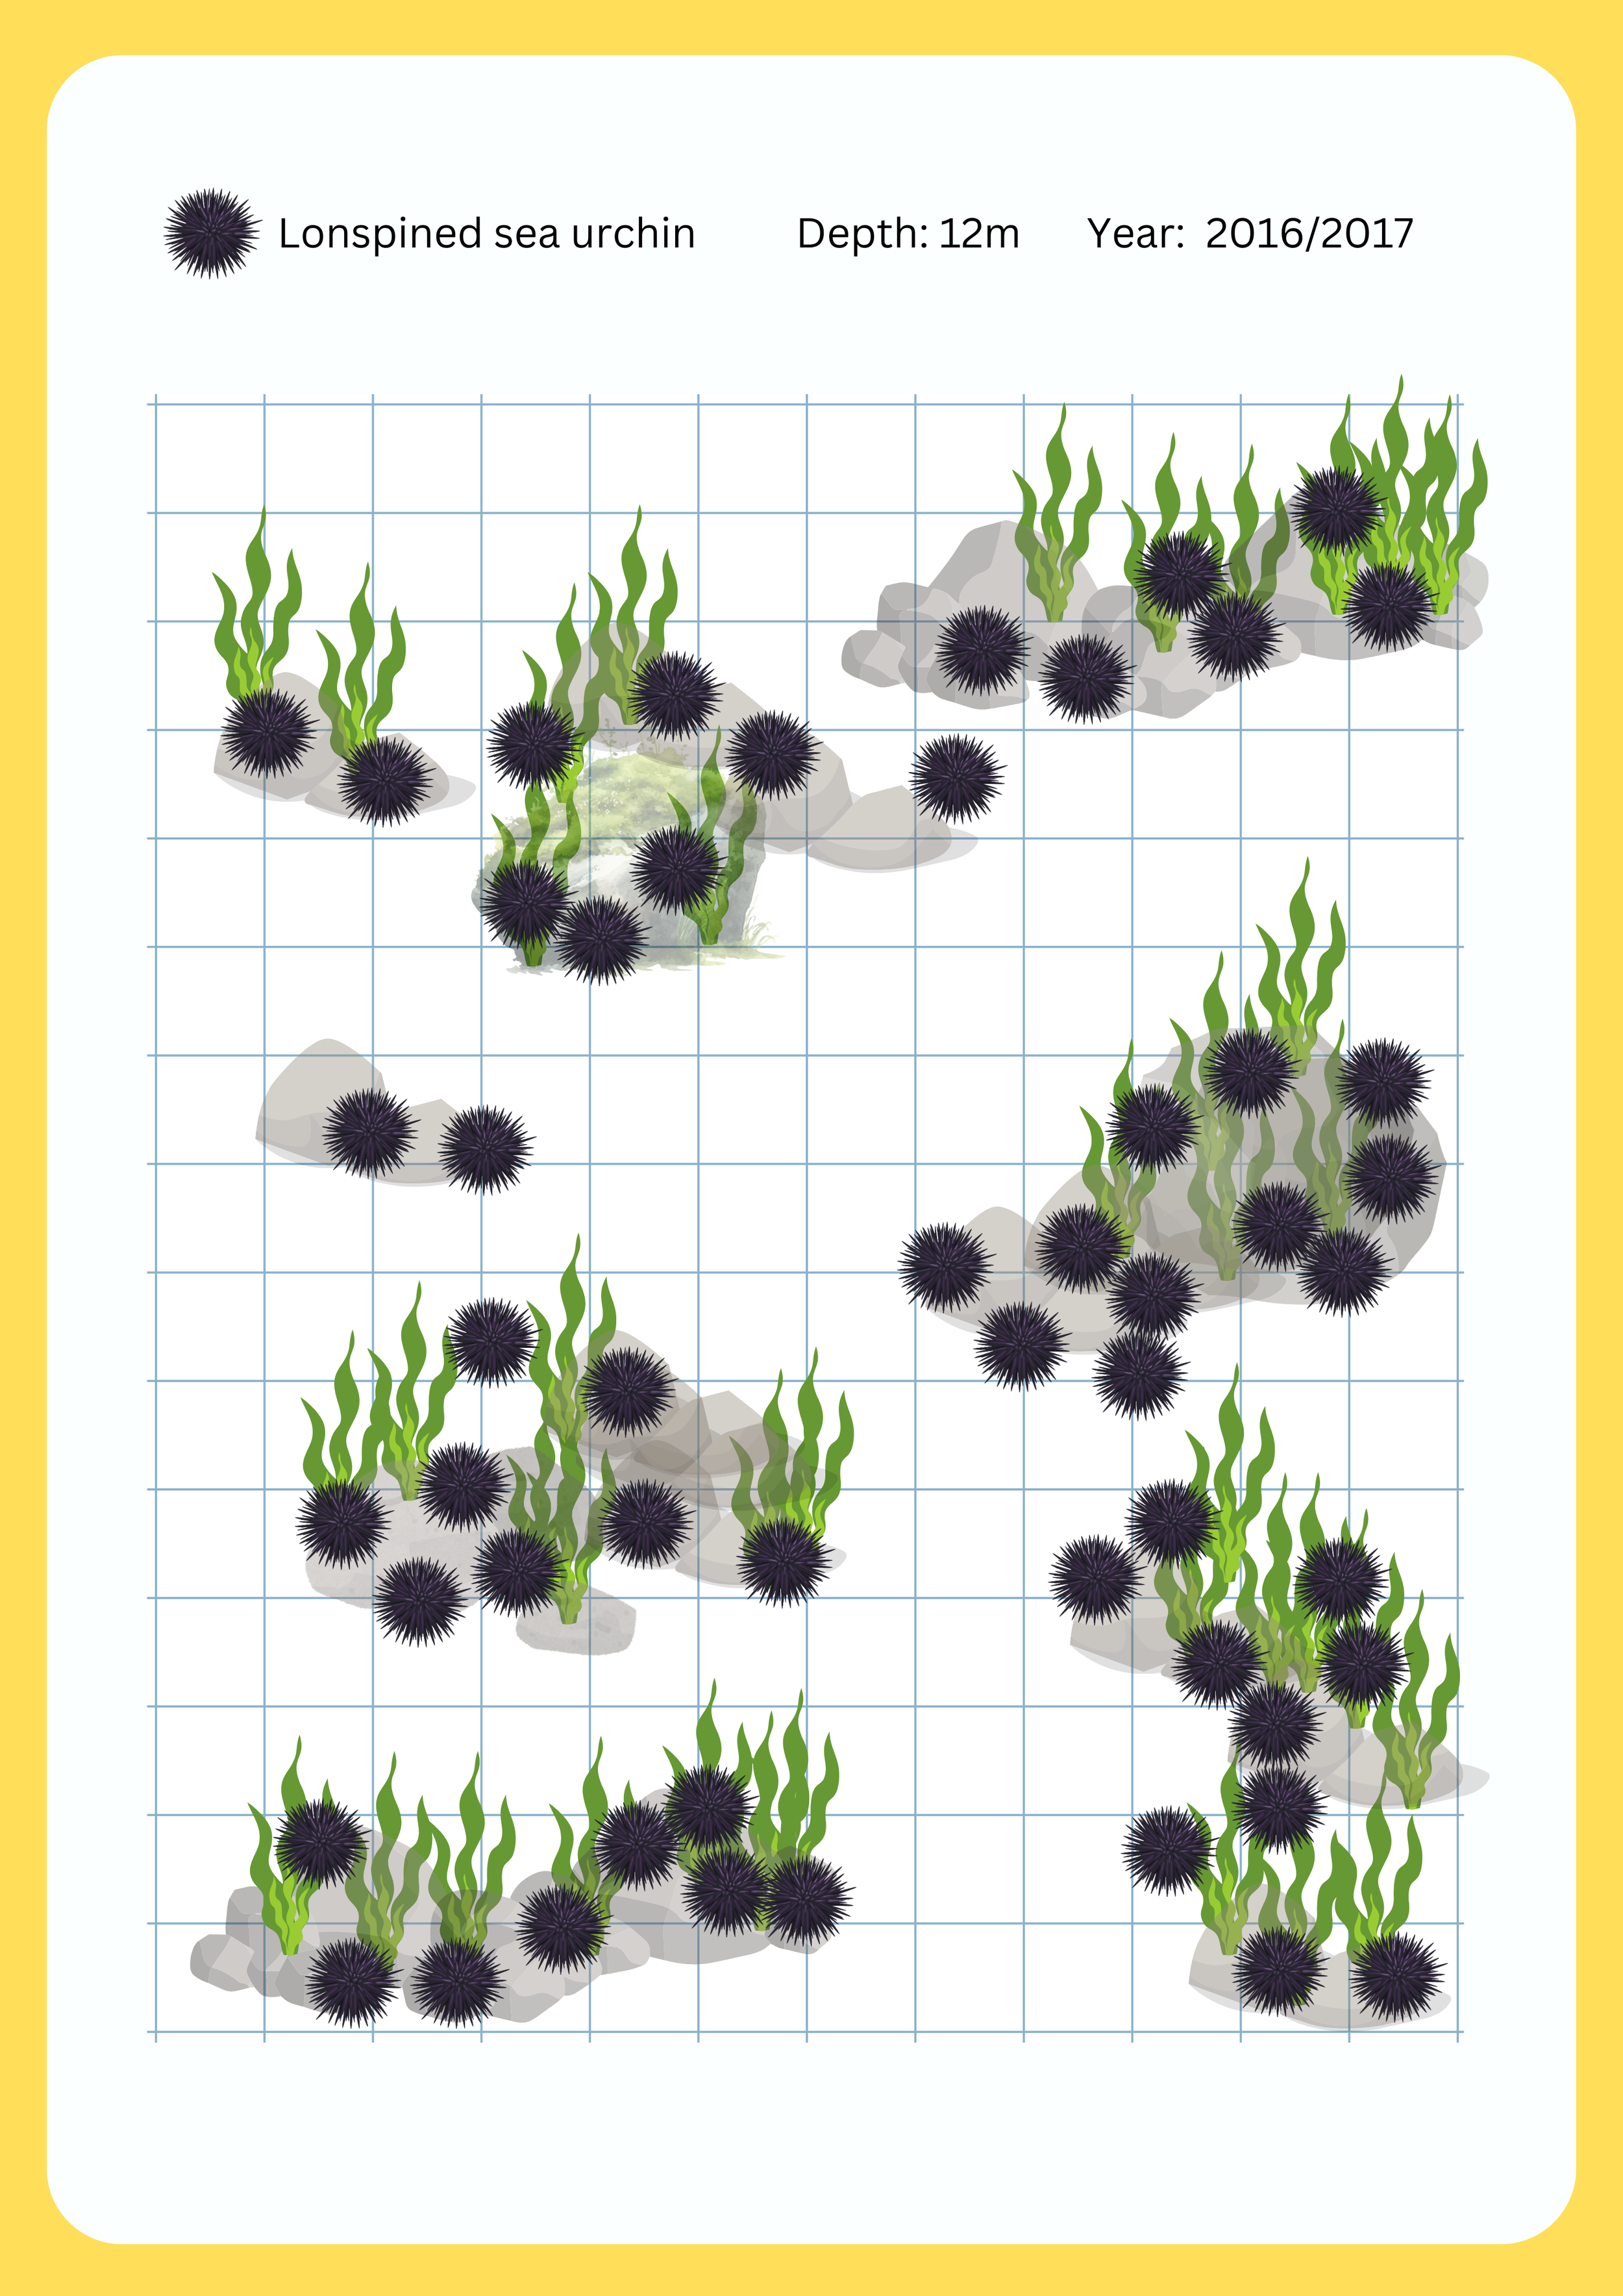
Example calculation
Total grid area = 200 m²
Number of 10 m² blocks = 200 ÷ 10 = 20
Urchin density at 12 m (2016/17) = 2.7 per 10 m²
Total number of urchins to draw:
2.7 × 20 = 54 urchins
Analysing patterns
11. Compare trends in sea urchin abundance and barren reef cover over time and across different depths.
12. Which depth categories show the largest increases in
sea urchin abundance
barren reef cover?
Do the patterns match?
13. Suggest reasons why changes in abundance and barren cover might differ across depth categories.
14. Explain the relationship between the abundance of longspined sea urchins and barren reef cover.
15. How does this data help illustrate the long-term impacts of climate change on marine ecosystems?
Self Reflection: Comparing Species and Analysing Data
Reflect on today’s lesson comparing longspined sea urchins and Crown-of-Thorns starfish.
For each statement, choose a traffic light.
🟢 Confident · 🟡 Getting there · 🔴 Still working on it